What is a Fishbone Diagram?
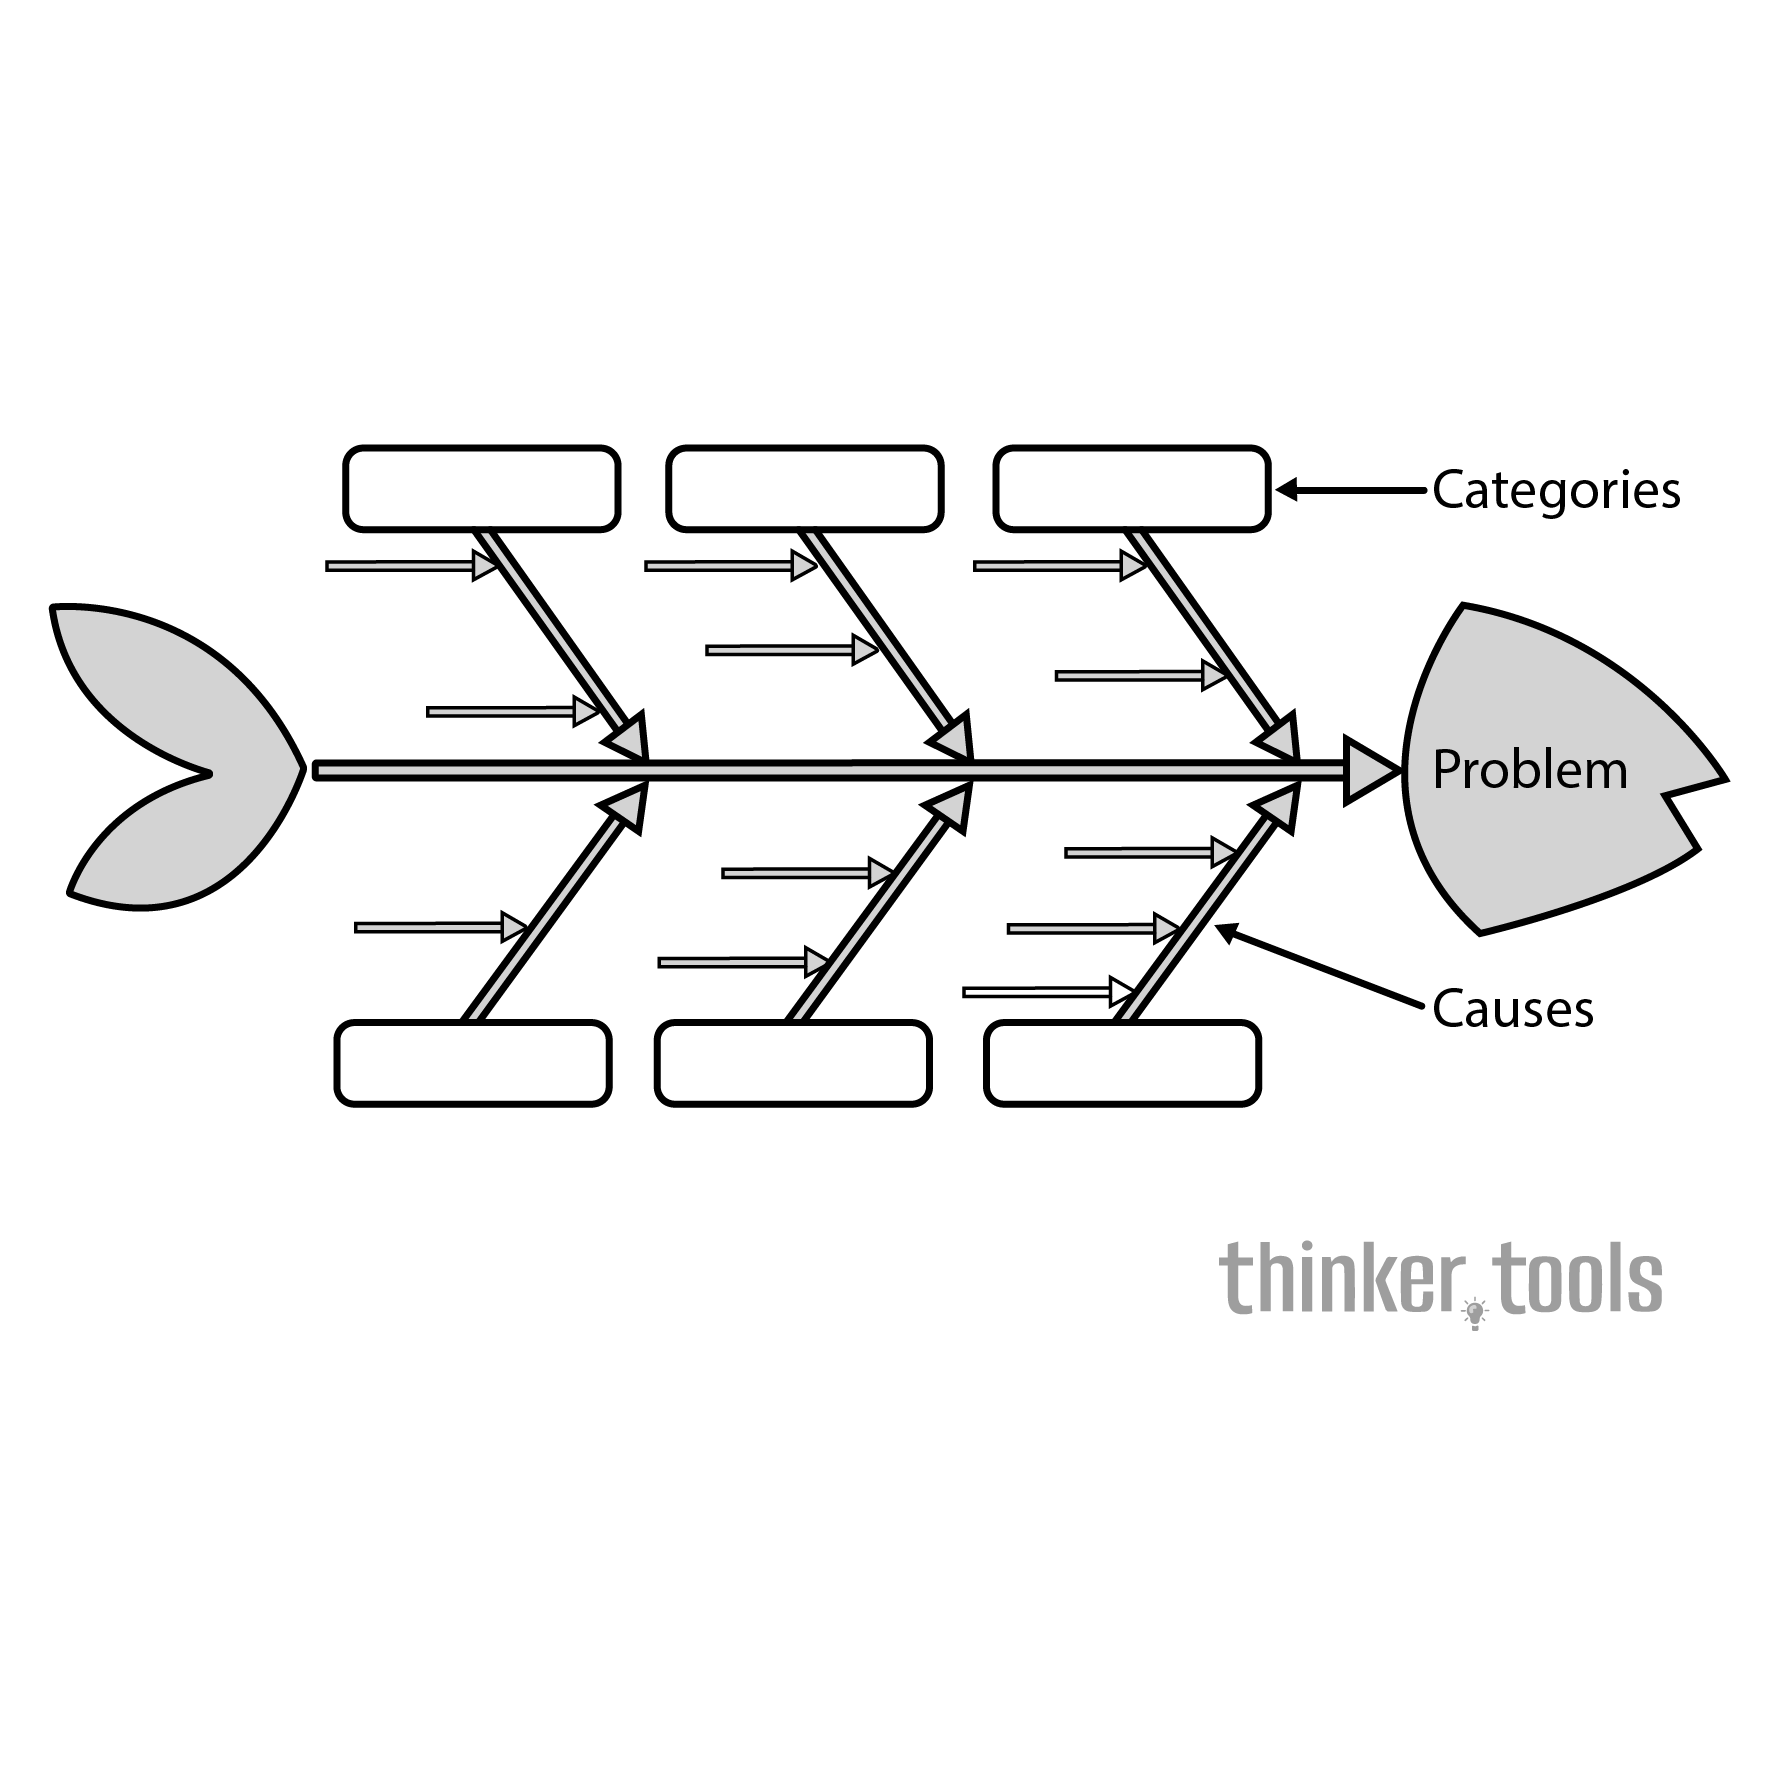
A Fishbone Diagram is a visual tool that maps out all potential causes contributing to a problem. Its distinctive shape—resembling a fish skeleton—organizes causes into major categories that branch off from a central "spine" leading to the problem (the fish's head). This structure ensures comprehensive analysis while maintaining clarity, helping teams move beyond surface-level fixes to address fundamental issues.
The History and Creator
Dr. Kaoru Ishikawa, a Japanese quality control expert, developed this diagram in 1943 while working at Kawasaki shipyards. Ishikawa believed that quality problems rarely had single causes and that effective problem-solving required considering all contributing factors. His diagram became a cornerstone of the quality management movement and remains one of the seven basic quality tools used worldwide in manufacturing, healthcare, software development, and beyond.
How to Create a Fishbone Diagram Step by Step
1. Define the Problem Clearly
Write your problem statement at the "head" of the fish:
- Be specific: "30% of orders ship late" not "shipping problems"
- Focus on one problem at a time
- State it neutrally without implying causes
2. Draw the Basic Structure
- Draw a horizontal arrow pointing to the problem (the spine)
- Add diagonal lines branching off (major bones)
- These represent cause categories
3. Identify Major Cause Categories
Standard categories include:
- Manufacturing: Methods, Machines, Materials, Manpower, Measurement, Environment
- Service: Policies, Procedures, People, Plant/Technology
- Marketing: Product, Price, Place, Promotion
- Custom: Create categories specific to your situation
4. Brainstorm Potential Causes
For each category, ask "Why does this contribute to the problem?"
- Use sticky notes for flexibility
- Encourage all ideas without judgment
- Think beyond obvious causes
- Consider interconnections
5. Add Sub-Causes
For each cause, dig deeper:
- Ask "Why does this happen?" repeatedly
- Add smaller bones for sub-causes
- Continue until you reach root causes
- Look for causes appearing in multiple categories
6. Analyze the Complete Diagram
- Circle the most likely root causes
- Look for causes you can control
- Identify causes appearing multiple times
- Consider which causes have the biggest impact
7. Validate and Prioritize
- Gather data to confirm suspected causes
- Test hypotheses when possible
- Prioritize causes by impact and feasibility
- Develop action plans for top causes
Practical Examples
Manufacturing Defect Analysis: A factory experiencing product defects creates a fishbone:
- Methods: Inconsistent assembly procedures, outdated work instructions
- Machines: Calibration drift, worn tooling, inadequate maintenance
- Materials: Supplier quality variance, improper storage
- Manpower: Insufficient training, high turnover, fatigue from overtime
- Measurement: Faulty testing equipment, sampling errors
- Environment: Temperature fluctuations, humidity, dust
Analysis reveals that temperature fluctuations cause material expansion, leading to assembly issues—a root cause no one initially considered.
Customer Service Problem: A call center with long wait times diagrams causes:
- People: Understaffing, skill gaps, low morale
- Processes: Complex phone tree, no callback option, inefficient routing
- Technology: Slow systems, frequent crashes, poor integration
- Policies: Rigid scripts, limited authority to resolve issues
The diagram reveals that slow systems force longer calls, creating a cascade effect. Fixing the technology addresses multiple symptoms.
Personal Productivity Issue: An individual diagrams why projects consistently run late:
- Planning: Underestimating time, no buffer for interruptions
- Environment: Open office distractions, too many meetings
- Tools: Inefficient software, poor organization systems
- Habits: Perfectionism, difficulty saying no, procrastination
- External: Unclear requirements, changing priorities
The visual reveals that perfectionism appears in multiple branches, suggesting it as a key intervention point.
Advanced Techniques
5 Whys Integration: For each cause, ask "why" five times to drill down to root causes
Weighted Fishbone: Size bones proportionally to their impact
Reverse Fishbone: Start with a desired outcome and map what enables it
Digital Fishbones: Use online tools for remote collaboration and easy updates
Benefits and Life Impact
The Fishbone Diagram delivers powerful results by:
- Preventing band-aid solutions through systematic root cause analysis
- Encouraging team collaboration with visual, inclusive brainstorming
- Revealing hidden connections between seemingly unrelated factors
- Building problem-solving discipline through structured thinking
- Creating shared understanding of complex problems
- Documenting institutional knowledge about what causes issues
- Saving resources by fixing root causes instead of repeatedly addressing symptoms
Whether troubleshooting technical problems, improving processes, or understanding personal challenges, the Fishbone Diagram transforms vague frustrations into clear, actionable insights. It shifts conversations from blame to understanding, from quick fixes to lasting solutions. By making all potential causes visible, it ensures you don't waste effort solving the wrong problem. Master this tool, and you'll find yourself solving problems once instead of repeatedly—addressing the disease, not just the symptoms.