What is a Gantt Chart?
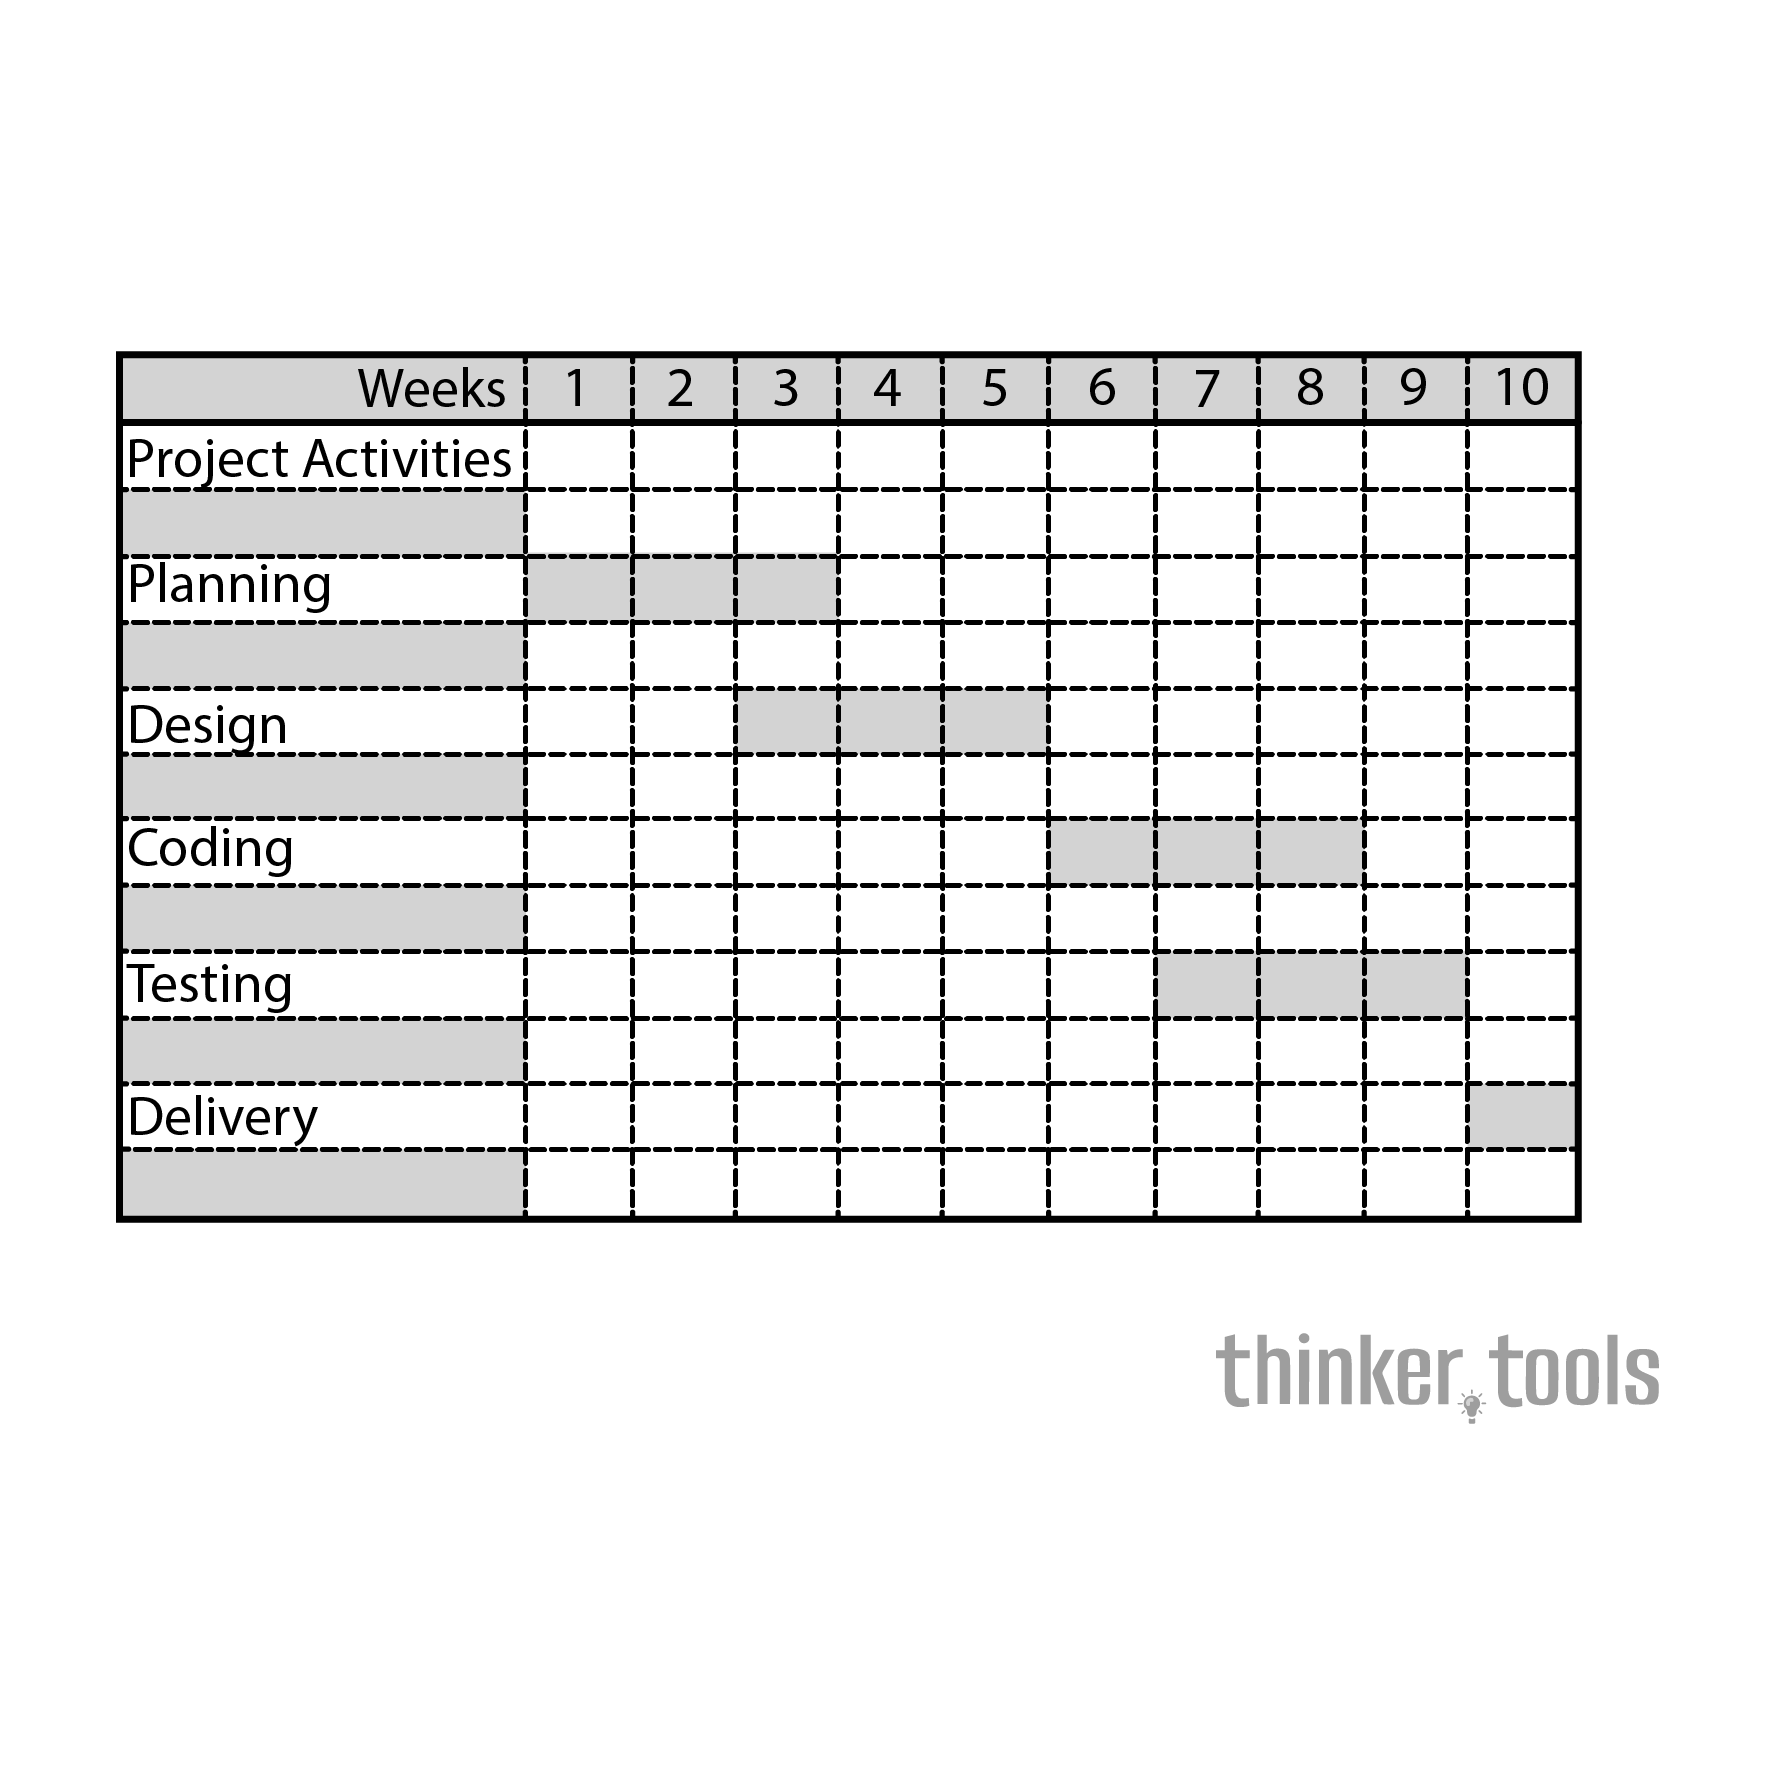
A Gantt chart is a horizontal bar chart that illustrates a project schedule over time. Each task is represented by a bar, with the position and length of the bar reflecting the start date, duration, and end date of the task. Dependencies between tasks are shown with arrows, creating a comprehensive visual map of your entire project.
The History and Origin
Created by Henry Gantt in the 1910s, this revolutionary tool was first used to track production schedules in factories during World War I. Gantt, an American mechanical engineer and management consultant, developed this visualization method to help supervisors quickly understand whether production was on schedule, ahead, or behind. His innovation was so effective that it became a cornerstone of modern project management.
How to Use a Gantt Chart: Step by Step
Step 1: List All Project Tasks
Begin by breaking down your project into individual tasks. Be specific and comprehensive—every significant activity should be included.
Step 2: Estimate Task Durations
For each task, determine how long it will take to complete. Be realistic in your estimates, considering potential delays and resource availability.
Step 3: Identify Dependencies
Determine which tasks must be completed before others can begin. These relationships form the backbone of your project timeline.
Step 4: Assign Resources
Identify who will be responsible for each task. This helps prevent resource conflicts and ensures accountability.
Step 5: Create the Visual Timeline
Plot each task as a horizontal bar on a timeline. The left edge represents the start date, and the bar's length represents the duration.
Step 6: Add Milestones
Mark significant project checkpoints or deliverables as diamonds or special markers on your timeline.
Step 7: Monitor and Update
As work progresses, update the chart to reflect actual progress, allowing you to identify delays and adjust schedules accordingly.
Practical Examples
Example 1: Website Launch Project
Imagine launching a new company website. Your Gantt chart might include:
- Week 1-2: Requirements gathering and design concepts
- Week 2-4: Design finalization (dependent on requirements)
- Week 3-6: Development (can start once design begins)
- Week 5-6: Content creation (parallel to development)
- Week 6-7: Testing and bug fixes
- Week 8: Launch preparation and go-live
Example 2: Product Development
For developing a new product:
- Month 1: Market research and concept development
- Month 2-3: Prototype creation
- Month 3-4: User testing (dependent on prototype)
- Month 4-5: Refinements based on feedback
- Month 5-6: Manufacturing setup
- Month 6: Launch preparation
Benefits and Life Improvements
Enhanced Clarity and Communication
Gantt charts eliminate ambiguity in project timelines. Team members instantly understand what needs to be done, when it needs to be done, and how their work affects others. This visual clarity reduces miscommunication and keeps everyone aligned.
Better Resource Management
By visualizing all tasks and their resource requirements simultaneously, managers can identify resource conflicts before they occur and balance workloads effectively.
Improved Time Management
Seeing the entire project timeline helps teams prioritize tasks and focus on critical path activities—those that directly impact the project completion date.
Risk Mitigation
Dependencies and potential bottlenecks become immediately visible, allowing proactive problem-solving before issues derail your project.
Increased Accountability
With clear task assignments and deadlines visible to all, team members take greater ownership of their responsibilities.
Stress Reduction
The clarity provided by Gantt charts reduces anxiety about project complexity. When everyone knows exactly what's expected and when, stress levels decrease and productivity increases.
Transform Your Project Management Today
Gantt charts transform the abstract concept of time into a concrete, manageable resource. Whether you're planning a small team project or coordinating a complex multi-department initiative, this visual framework brings structure to chaos and clarity to complexity. By adopting Gantt charts in your workflow, you're not just improving project management—you're creating a culture of transparency, accountability, and success that benefits everyone involved.